www.vugtk.cz
Deformation Analysis
www.vugtk.cz/~deformace
Deformation Analysis
Examples
- Monitoring motions and the surface deformations Coal quarry ČSA (Czechoslovak army) in Komořany (NW Bohemia)
- Monitoring motions and the surface deformations area of coal basin Ostrava (NE Bohemia)
- Egypt - Asuan Lake, The Kalabsha fault
Monitoring motions and the surface deformations - Coal quarry ČSA (Czechoslovak army) in Komořany (NW Bohemia)
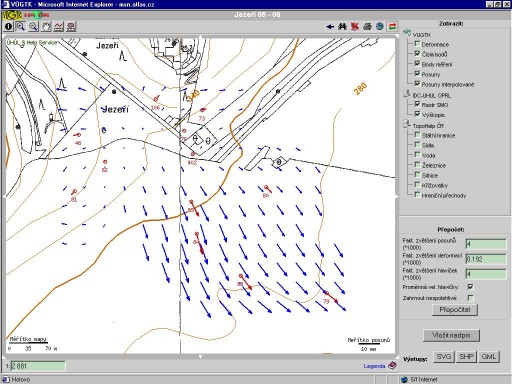
Jezeří area is limited local monitoring network, close to the coal quarry ČSA in Komořany. Repeated measurements were
performed for repeated debris chute threating to coal quarry and close castle Jezeří as well.
Data input is from 02/1994 and 05/1994:
|
jezeri05.lst |
jezeri06.lst |
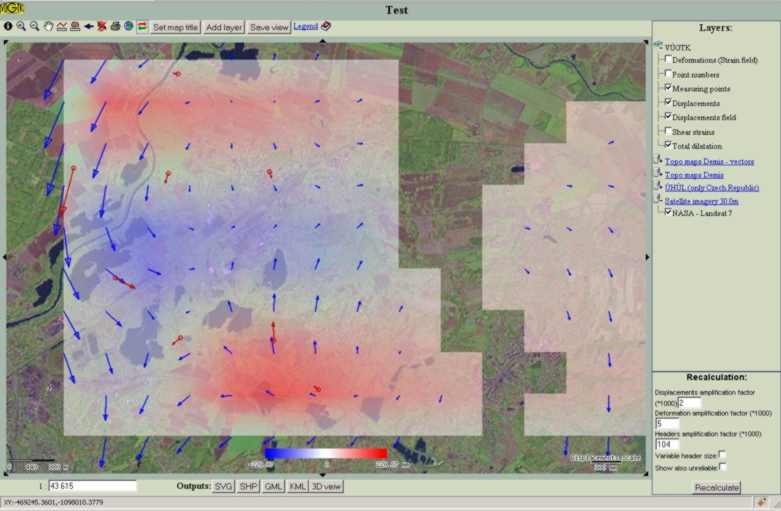
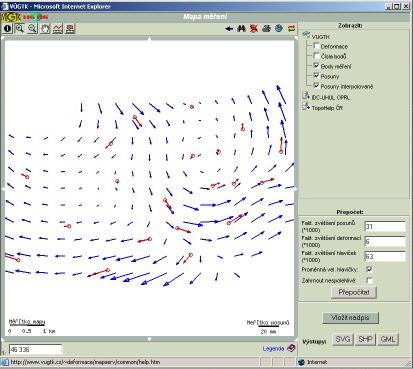
Numeric result is text file with values of displacements and values of deformations in grid. Graphical output is interactive. It is possible to change scales, display of point id and include topographic layer like TopoHelp ČR or Landsat etc. Resulting picture can be saved as bmp, gif or jpg, GML, SVG a ESRI Shapefile (SHP). The field of horizontal displacements on grids and the field on main axes of horizontal deformations on grids within the area is showed. Arrows in deformation field picture indicate the orientation to compression (blue) - to the center of cross, or extension (green) - outside the center of cross.
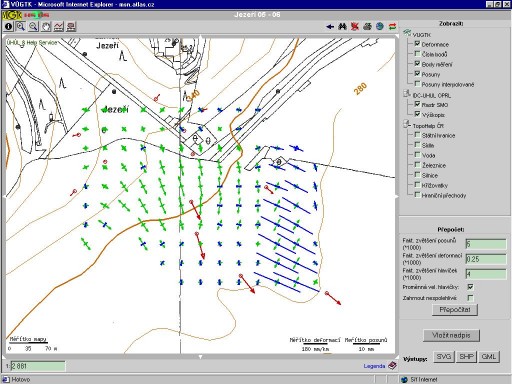
It is useful to use topografic layers for work with results - for examle contour lines. Displacements may seem to go uphill, which is caused by Helmert tranformation used to compute geodetic measurements. But horizontal deformations, represented by principal axes of compression or extension are independ on this and answer to the real situation well.

Monitoring motions and the surface deformations - area of coal basin Ostrava (NE Bohemia)
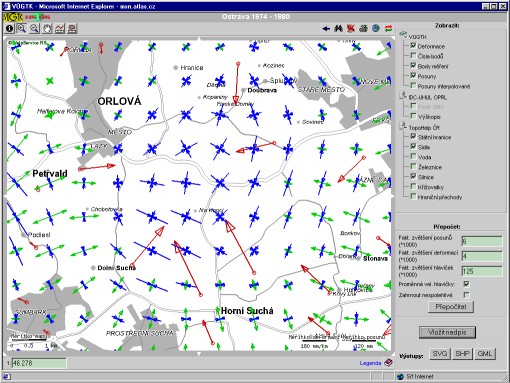
Data input from area of coal basin Ostrava (NE Bohemia) is older (1974 and 1980) but still suitable for coal basin locality where higher displacements are expected.
ostrava.dxy
1 1095807.2 457110.1 61.337 -25.489
2 1096814.2 452215.3 77.890 35.507
3 1099383.9 456244.8 202.424 11.451
4 1092448.9 466404.8 -2.501 47.996
5 1094314.9 468486.5 484.608 126.315
6 1094423.3 466603.7 93.523 28.647
7 1094392.7 464592.4 59.036 -20.413
8 1096501.4 467656.4 97.808 -192.003
9 1097682.3 466359.0 67.790 81.754
10 1097747.6 464504.7 -181.339 10.887
.
.
.
111 1119376.3 462465.6 -106.586 76.272
112 1118125.9 467878.6 -87.450 26.198
113 1110275.1 459758.3 -54.270 116.045
114 1110541.9 457957.4 -60.971 41.124
Input data: txt, S-JTSK
Input data: txt, S-42
Input data: XML, S-JTSK
Input data: XML, S-42

Egypt - Aswan High Dam, The Kalabsha fault
Aswan High Dam is 3,600 m in length, 980 m wide at the base, 40 m wide at the crest and 111 m tall. At its west side, about 100km away, along the Kalabsha fault, were the earthquake in 1981 and threatened to damage the Dam.
VUGTK-ICRCM (International Centre for Recent crustal movements) Zdiby has built local inner networks with UNESCO support. It was monitoring horizonal and vertical changes to anticipate seismical changes.
Input data txt (1), (2).
Input data xml (1), (2).
Other possibilities
Display Shear strains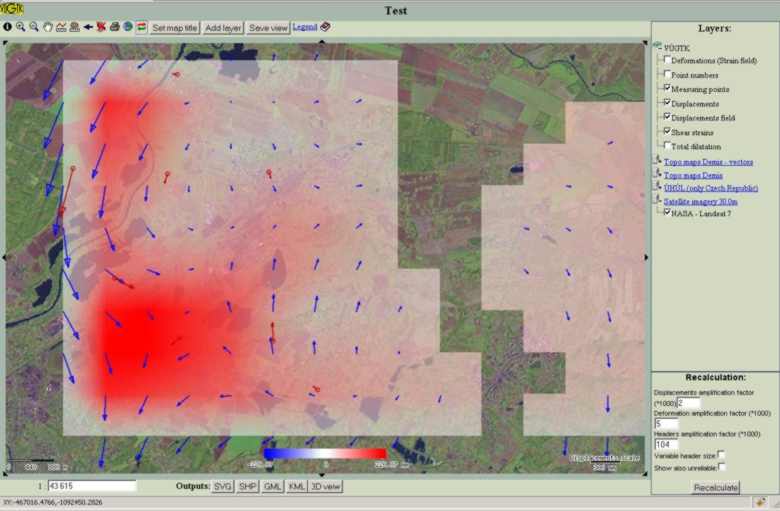
Display Total dilatation