BASIC INSTRUCTION HOW TO USE Deformace
Before first use of application is needed to fill short registration form at following address:
http://www.vugtk.cz/~deformace/pgm/registration/
![]() Detailed
information about data
Input format
Detailed
information about data
Input format
Once you have prepared input data follow the instructions:
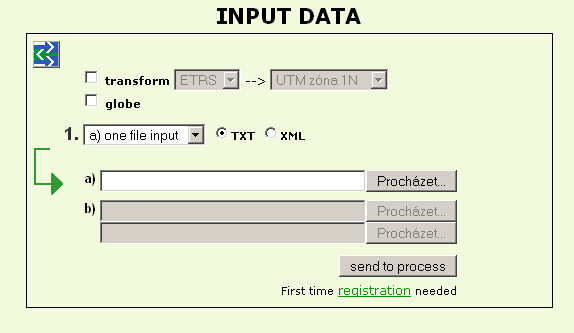
Input data fines are sent to vugtk server (www.vugtk.cz/~deformace) through input form showed on Pic 1. Radio button serves for choice between txt and xml input and green arrow can be clicked on to choose between one or two files input. Check the tranform if you want to use ETRS coordinates as input. Coordinates will be transformed into UTM an computation will continue in classical mode. Check the globe if you want to use computation of grid on globe. Details: Globe-modul
Picture.1. Input data
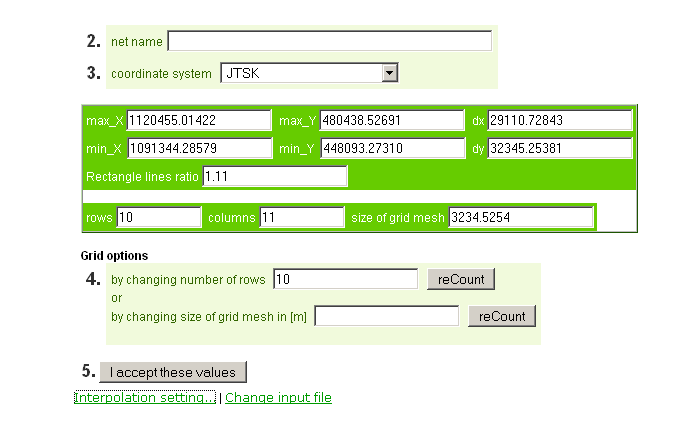
In next form is possible to fill the name of your task. Important is to choose right Reference coordinate system.
(All supported ones are listed as well in http://www.vugtk.cz/xml/surveying/dtd/sour_soustavy.pdf )
Czech Republic:
JTSK Pulkovo 1942/ Gauss-Kruger zone 3
WGS 84 / UTM zone3N
Next parameters to set serves for computation of grid. The change of grid cell size is main parameter to set.
Parameters for interpolation differs in accordance to type of computation you have choused. They have set basic reasonable values so you don’t have to change them necessarily for first computation, but it is recommended to try more different values to get best results.
Picture. 2. Grid and interpolation
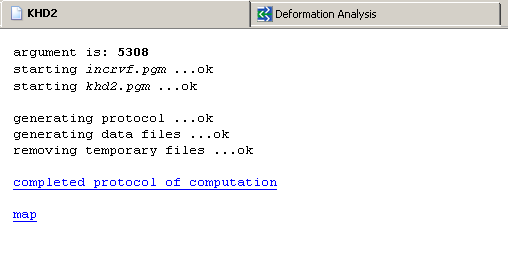
Once you are satisfied with all parameters accept values to send them to computation. You get information about its progress in following screen. You work also get ID. When computation is finished you can continue to text protocol (to save it) or to study results on map .
Picture. 3. Computation
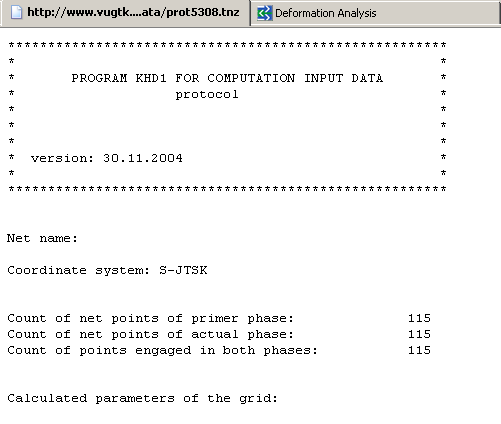
Picture. 4. Text protocol
After clicking on map interactive graphical result is opened (MSIE). The field of horizontal displacements on grids and the field on main axes of horizontal deformations on grids within the area is showed. It is possible to change scales,display of point id and include topographic layers like TopoHelp ČR or Landsat etc to study it with results . Resulting picture can be saved as bmp,gif or jpg as well. Also in XML formats SVG and GML. Shapefile output is also possible. Application uses (Open Source license) mapserver MAPSERVER from Minesotta University, USA.
Picture 5 – Graphical output can look like this…
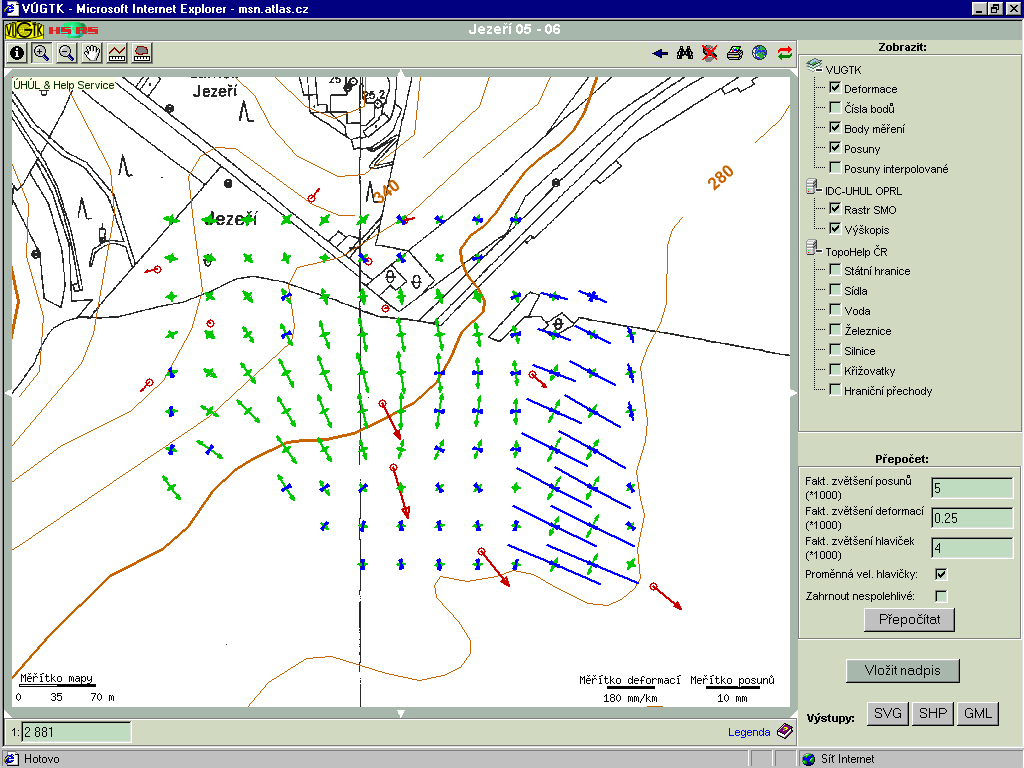
Main result is the field of horizontal displacements on grids and the field on main axes of horizontal deformations on grids within the area is showed. Arrows in deformation field picture indicate the orientation to compression (blue) - to the center of cross, or extension (green) - outside the center of cross.
RELATING ITEMS
![]() Monitoring
motions and the surface deformations - Coal quarry ČSA inKomořany
Monitoring
motions and the surface deformations - Coal quarry ČSA inKomořany